Mapping the Continent: GIS Connectivity Modeling with Alex Vanko
At the intersection of technology, science, and art is the foundation that guides our conservation strategy: mapping. We work across North America to identify, analyze, and visualize wildlife habitat connectivity using geographic information systems (GIS). With this technology, we predict wildlife movement across landscapes and pinpoint the most vital areas to reconnect and restore.
GIS connectivity modeling is a unique blend of hard sciences and rapidly evolving technology, allowing us to meet the quick pace of climate change and human development. We’re sharing an overview of three of our most widely used modeling tools: Linkage Mapper, Circuitscape, and Omniscape. These are free, open-source software created and maintained by communities of experts and institutions to which we’re very grateful.
Read on to see how our GIS Specialist, Alex Vanko, breaks down each modeling tool to get a comprehensive perspective of wildlife connectivity.
Linkage Mapper:
One of the simplest ways to map wildlife habitat connectivity is using least-cost paths, or paths of least resistance, between patches of habitat. To map these vital connections, we first define areas of habitat for a given species (or group of species). Then we classify the landscape based on how well it facilitates wildlife movement, using habitat information like land cover and hindrances to movement - barriers like highways, urban development, or very steep slopes.
We express this landscape resistance as cost, which can mean the actual cost in time and calories of an animal moving through a landscape or its risk of mortality while traveling. For example, a timber rattlesnake moving across the coastal plain of North Carolina would face very low landscape resistance cost moving through its preferred habitat (longleaf pine savannah) and much higher resistance when crossing a highway through an agricultural field.
Linkage Mapper is a set of GIS tools that allows us to draw least-cost paths between habitat cores using landscape resistance. The result is a core – corridor map that predicts the most important connections for wildlife to move, thrive, and survive.
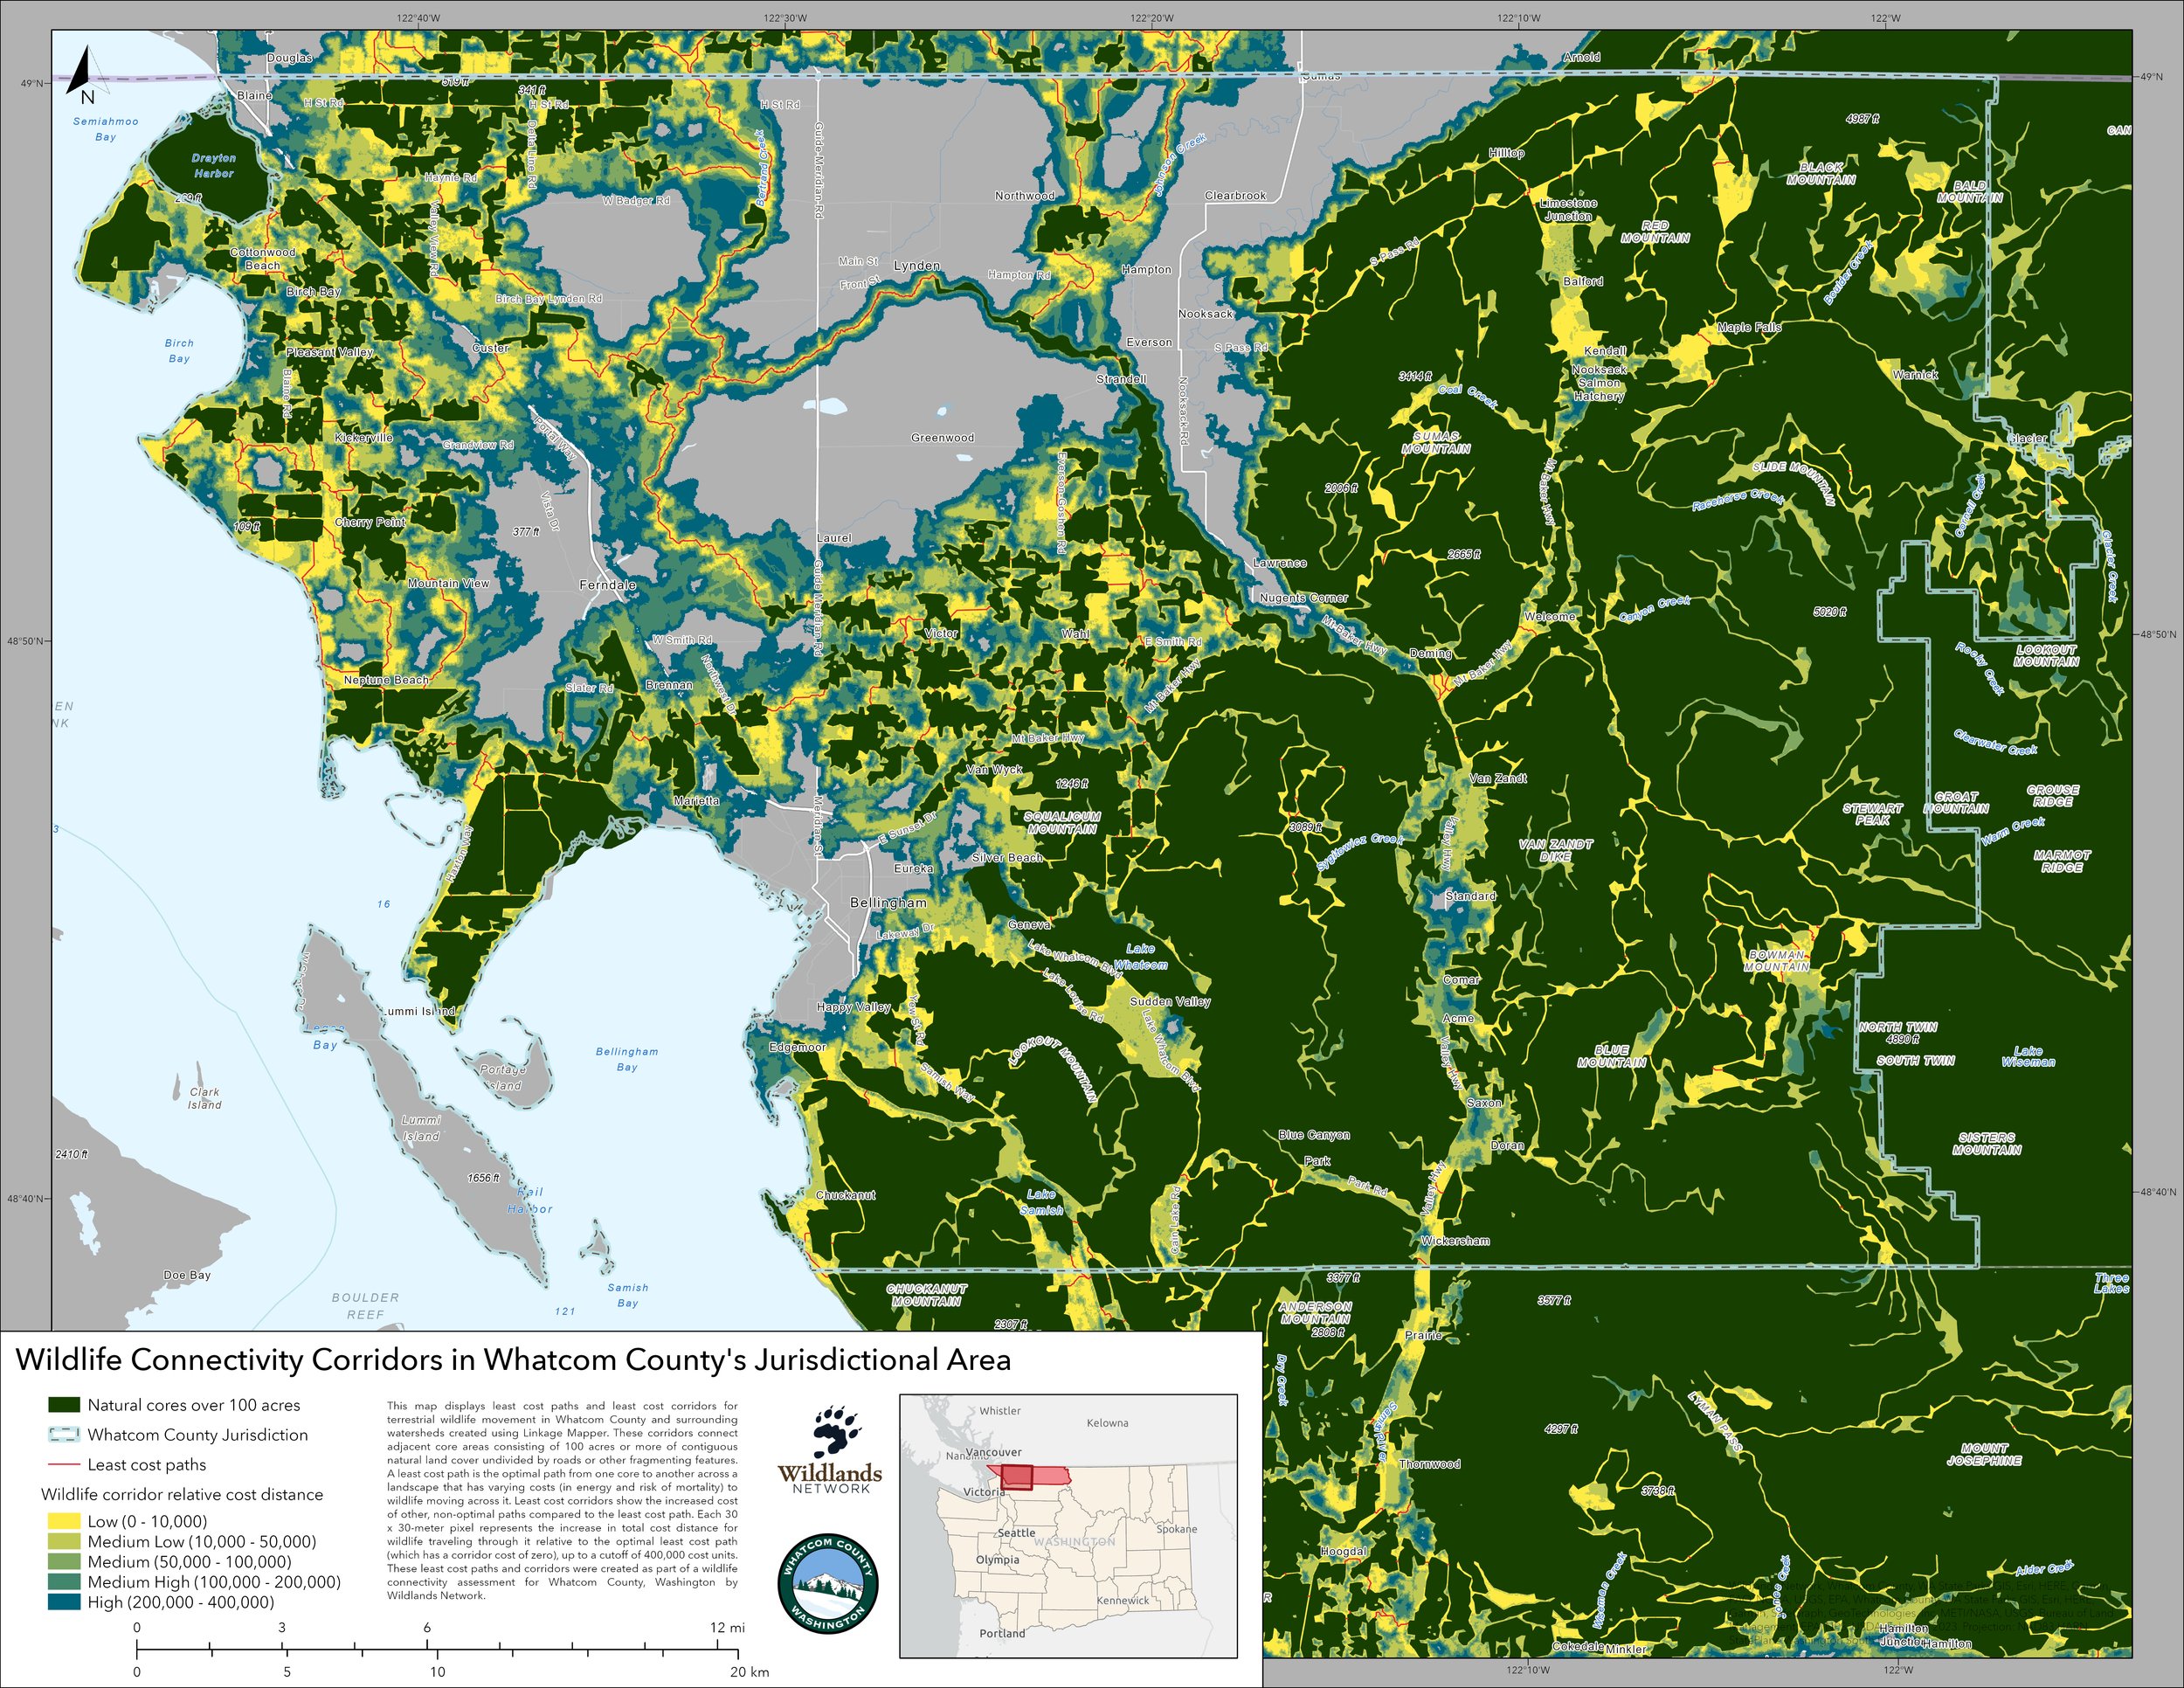
Below is a map we made for Whatcom County, Washington using Linkage Mapper to find critical connections for terrestrial species between the best habitat in this fragmented landscape. You can see the natural cores in green, the least cost paths in red, and broader wildlife corridors that range from easy to more difficult to move through in yellow–blue.
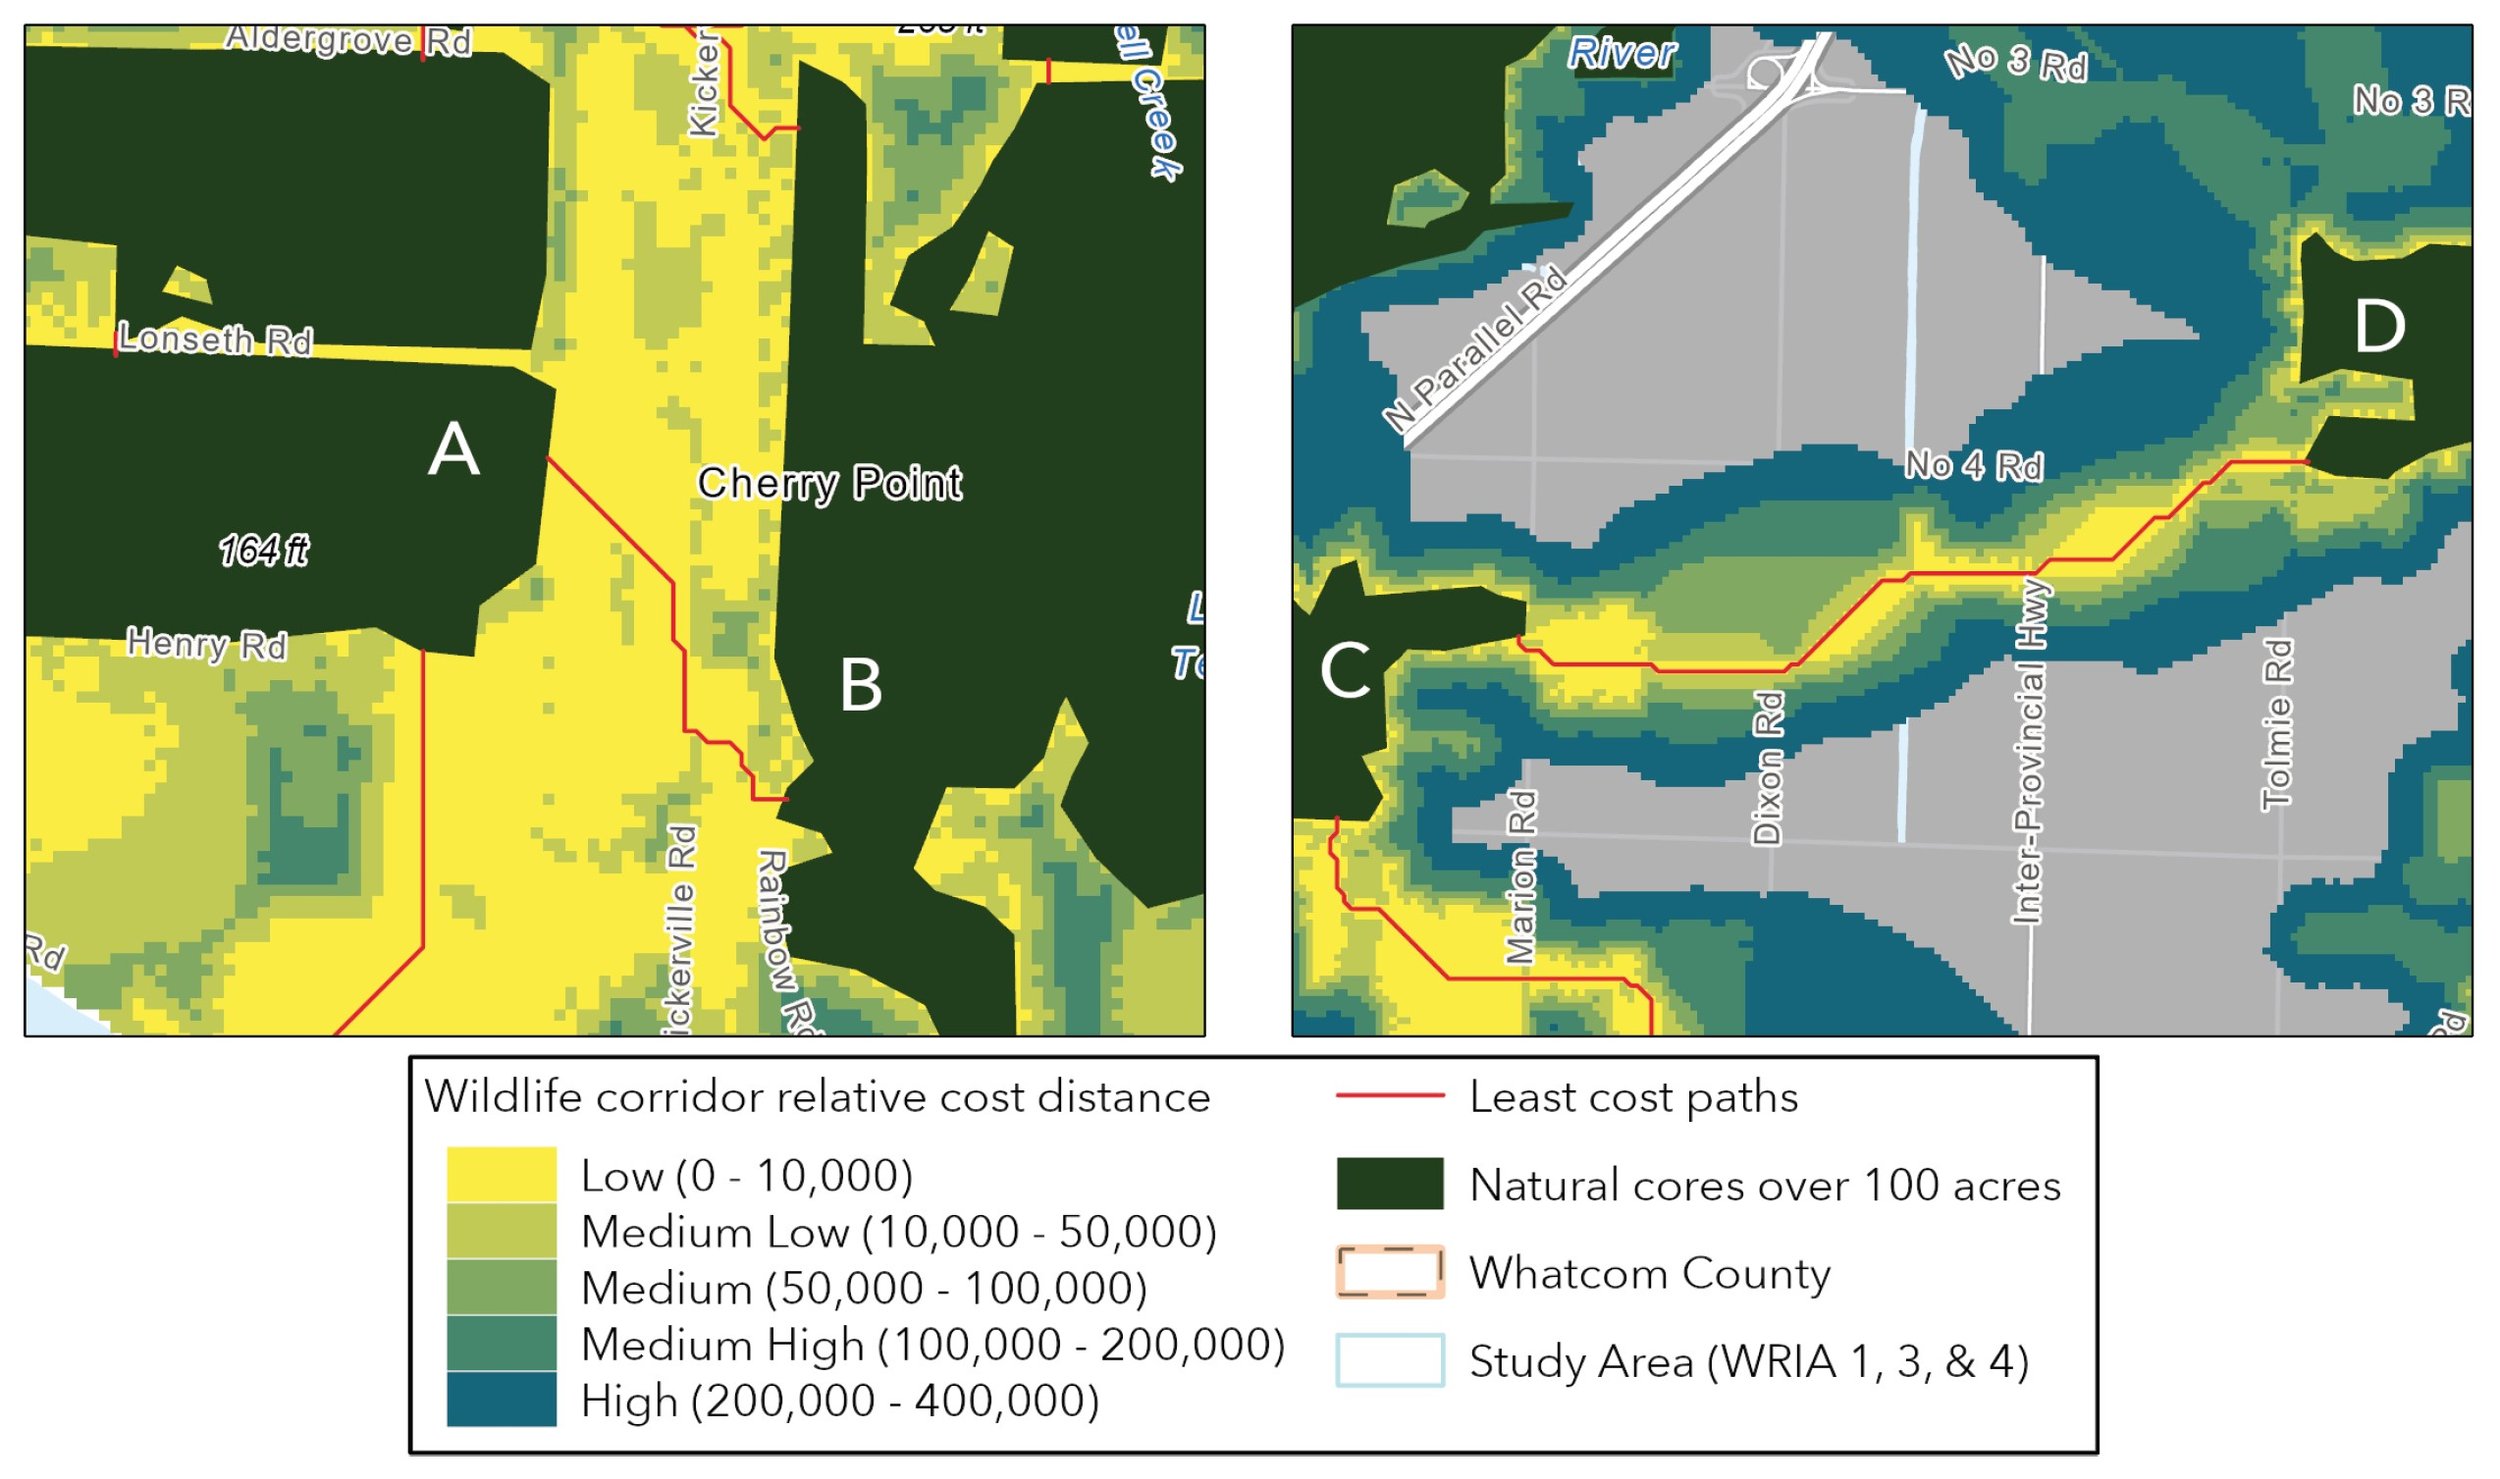
Linkage Mapper can also show us whether the connection between two habitat cores is relatively easy for wildlife to move through (like the corridor on the left, below) or is narrow and constricted by high-resistance areas like urban neighborhoods (on the right).
By identifying these corridors, Whatcom County can restore and protect wild spaces and facilitate wildlife movement as the County continues to develop. These maps help us understand terrestrial species that are sensitive to human development and fragmentation by predicting their movement.
Least-cost paths, cores, and corridors are straightforward tools for predicting wildlife movement, but they don’t necessarily match the reality facing animals moving across a landscape. Animals often don’t have perfect knowledge of the landscape or even a clear destination, so they typically don’t exactly follow the least cost path between two clearly defined cores. Connectivity models using circuit theory can help fill in the gaps.
Circuitscape:
Circuitscape is a connectivity modeling tool that predicts patterns of species movement across a landscape using circuit theory. This essentially supposes that animals make decisions about where to go based on the landscape in their immediate vicinity, similar to the way electrons move across a conductor surface with varying resistance.
Whether animals (or electrons) move north, south, east, or west is simulated as a probability based on the relative resistance in each direction. When we add up all of these probable movements, we get a heatmap showing how likely each path across a landscape will be used by wildlife.
In Circuitscape, we define the habitat cores we want to connect as nodes. We then find the most probable paths from one node to another by simulating individual animals as electric current flow. Unlike Linkage Mapper, which finds the one path of least resistance, Circuitscape can result in multiple viable paths for wildlife to travel from one patch of habitat to another.
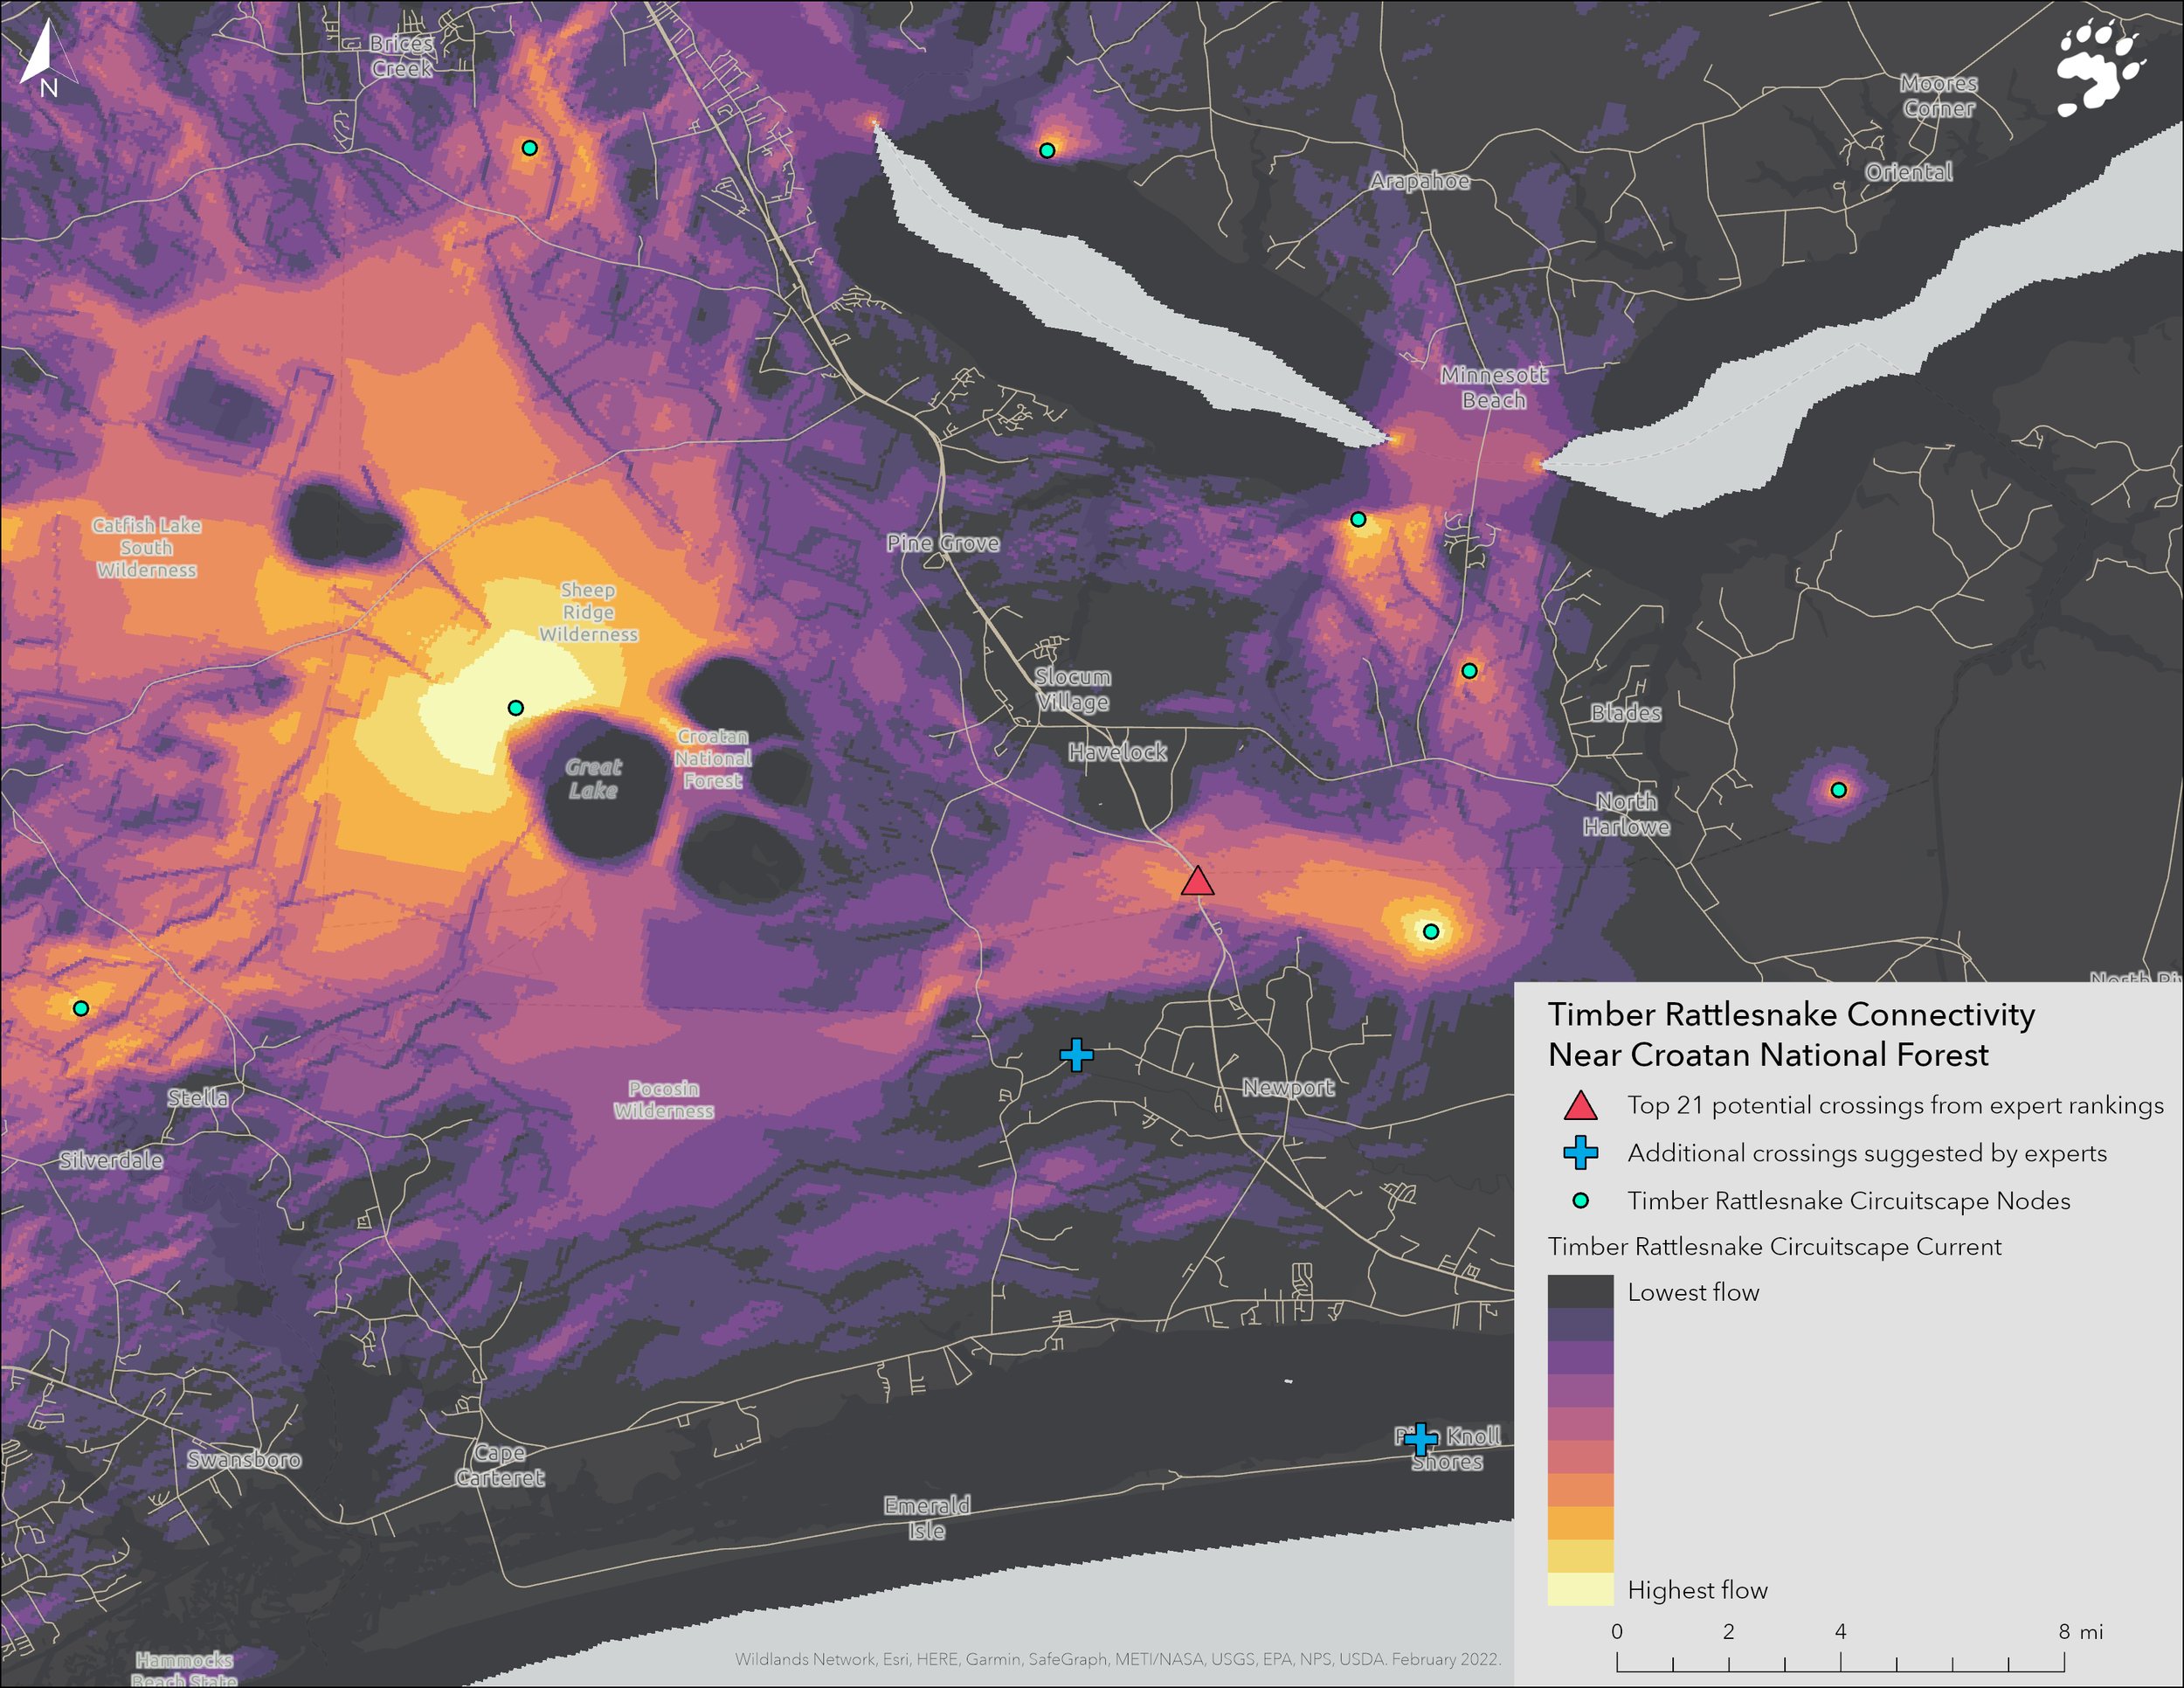
In the example below, we simulated the movement of timber rattlesnakes between habitat nodes (teal-colored points) near Croatan National Forest in North Carolina. The bright yellow and orange areas are the paths most likely to be used by rattlesnakes moving across this area as they avoid urban development and deadly roads.
By understanding where rattlesnakes typically move, we were able to identify a high-priority site for a potential wildlife crossing to benefit rattlesnakes and other species in this area (see the red triangle in the map below).
Circuitscape can offer a more realistic prediction of how wildlife moves, but, as with Linkage Mapper, we can only use it to predict movement between point A and point B (defined habitat cores). However, we now have omnidirectional circuit theory models that can predict wildlife movements across an entire landscape, from any point to any other point in any direction.
Omniscape:
The newest tool in our connectivity modeling toolbox, Omniscape, uses the same landscape resistance information to simulate wildlife movement anywhere for any reason, without being limited to movements from habitat core to habitat core. It does this by treating every pixel on the landscape as a target in turn and calculating all the possible paths that wildlife might take to get there. Add up all of these likely paths and we get a heatmap of the most likely predicted paths that is similar to Circuitscape but doesn’t rely on defined habitat core areas.
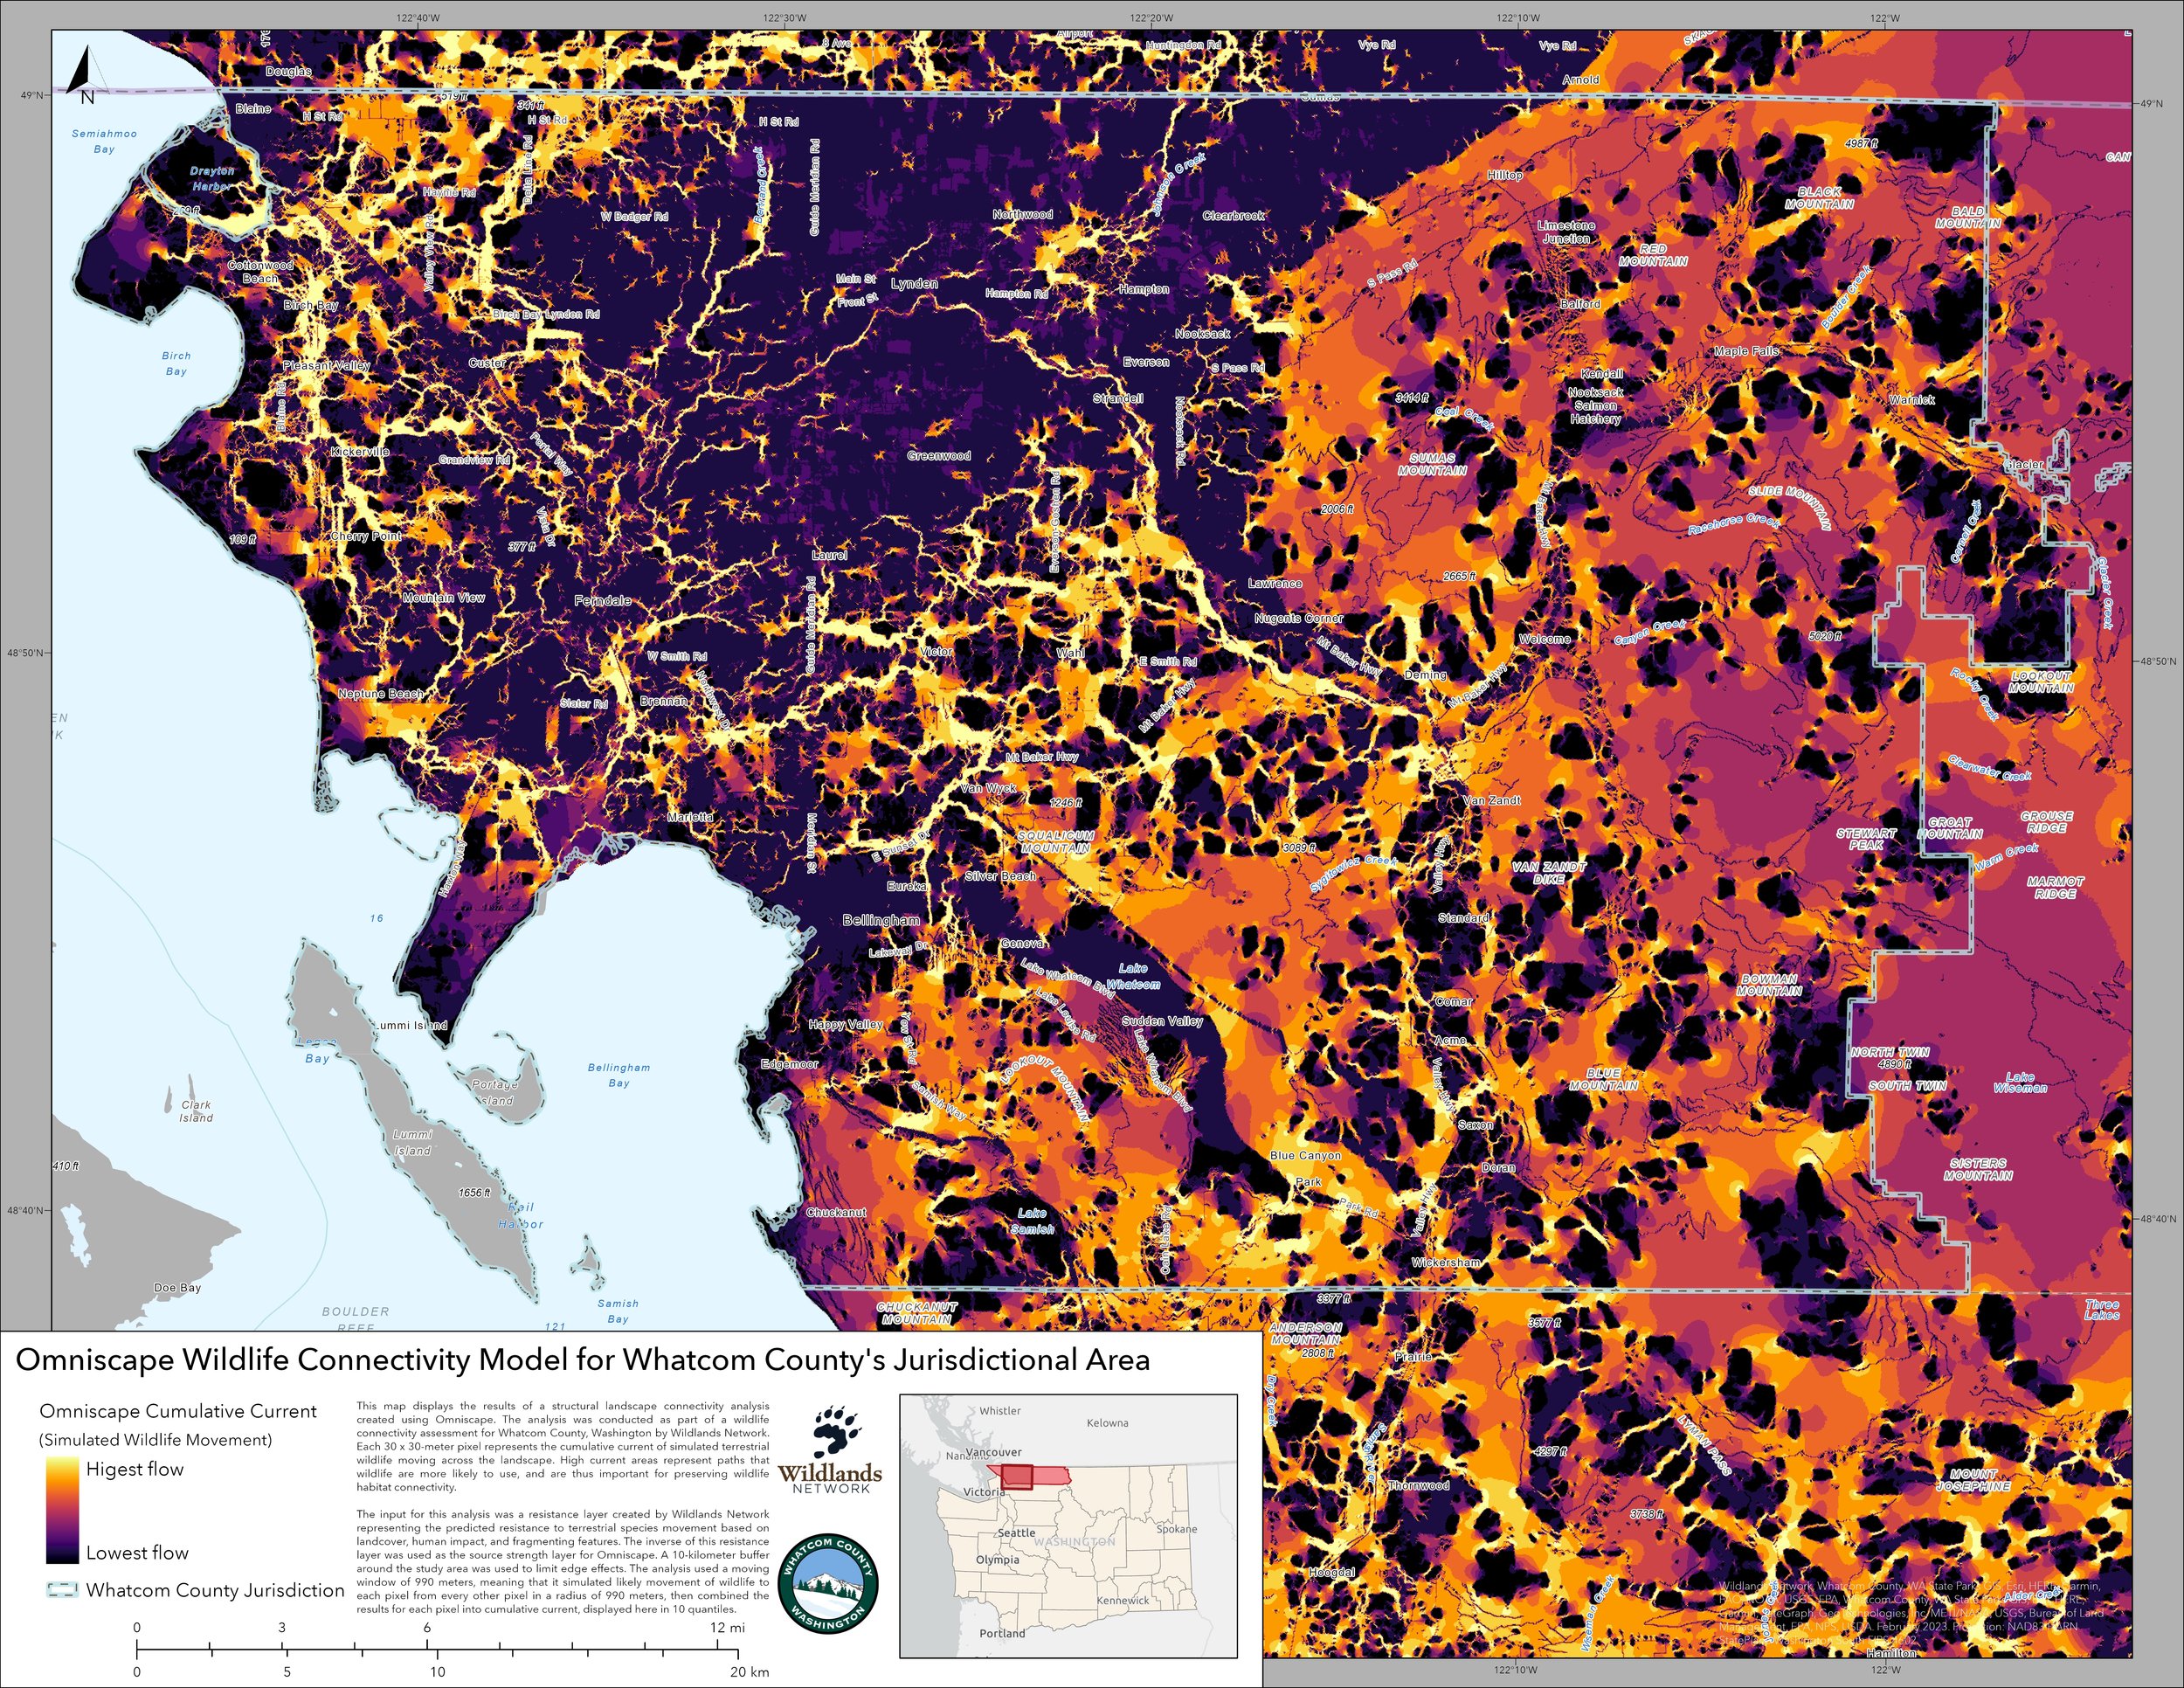
For example, see the same map of Whatcom County below, this time with an Omniscape model where bright yellow/orange areas are predicted to be the most important corridors for wildlife movement.
Predicting how wildlife move across their landscape in the face of resistance, risk of death, and fragmentation caused by human development is one of the most important challenges we face as conservationists. These and other connectivity models help us recognize the most critical areas for wildlife habitat connectivity so we can maintain those connections, reconnect those that have been severed, and ensure all our wildlife has the ability to survive into the future.